How to Read a Topographic Map: Contours, Scale and Trail Steepness
By the Outdoors Haven editors 8 min read Updated September 29, 2026
Pack this into your head
- Each contour line connects points at the same elevation.
- The contour interval, printed in the map margin, is the height between lines.
- Close lines mean steep terrain; widely spaced lines mean flat ground.
- In valleys the V of the contours points uphill, toward the source of the stream.
- On USGS 1:24,000 maps, 1 inch equals 2,000 feet.
- USGS US Topo maps download free, but may not show every trail.
On this route
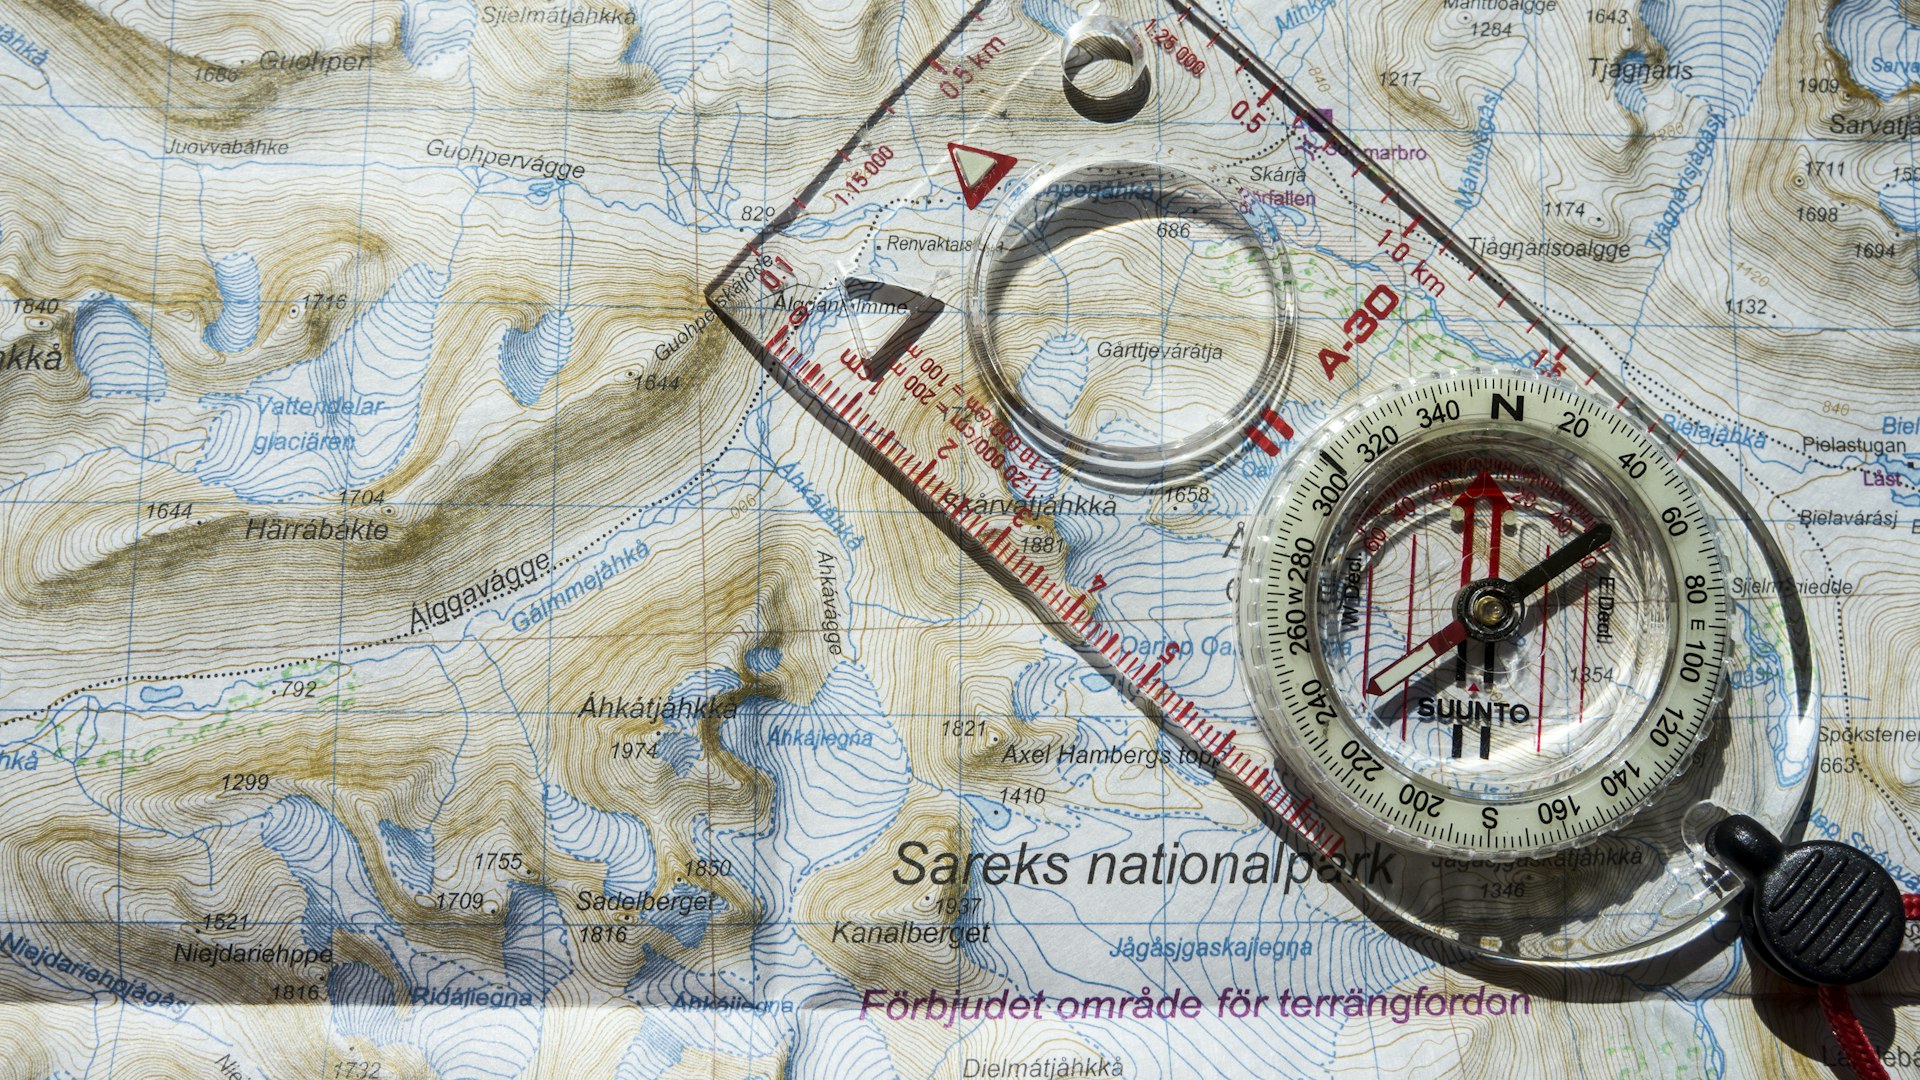
To read a topographic map, start with the brown contour lines. Each one connects points at the same elevation, and the contour interval printed in the map margin tells you how many feet of height separate one line from the next. Lines packed close together mean steep ground; lines far apart mean gentle ground. V shapes pointing uphill mark valleys and streams, V or U shapes pointing downhill mark ridges, and small closed loops are hilltops. The scale bar converts map distance to real distance.
That’s enough to spot where a trail climbs hard and where it flattens out. The rest of this guide covers each part in turn, then walks through measuring a trail’s steepness from the map, which is the most useful skill for planning a hike.
What a topographic map shows
A regular road map is flat. A topographic map adds the third dimension. The USGS defines it by its use of elevation contour lines to show the shape of the Earth’s surface, along with roads, rivers, lakes, boundaries and place names.
The classic US topographic map is the USGS 7.5-minute quadrangle, at a scale of 1:24,000. Each “quad” covers 7.5 minutes of latitude by 7.5 minutes of longitude, roughly 8.6 miles north to south and 6 to 7 miles east to west in most of the Lower 48, and is named after a prominent feature on it. Commercial trail maps from publishers such as National Geographic Trails Illustrated often use the same USGS elevation data at smaller scales, adding trail names and mileage.
Colors and symbols
| Color | What it shows |
|---|---|
| Brown | Contour lines and elevation |
| Blue | Water: lakes, rivers, streams, marshes, glaciers |
| Green | Woodland and forest cover |
| White | Open ground with little tree cover: meadows, rock, alpine terrain |
| Black | Human-made features: buildings, roads, trails, names, boundaries |
| Red | Major roads and public land survey lines |
Trails usually appear as thin dashed black lines. A solid blue line is a stream that runs year-round; a blue line broken by dots is an intermittent stream that may be dry in late summer, which matters when you’re planning water.
Contour lines and contour intervals
Imagine slicing a mountain horizontally every 40 feet and tracing the outline of each slice onto paper. That’s a contour map. A few rules always hold:
- Every point on one contour line is at the same elevation.
- Contour lines never cross or split. They can merge only at a vertical cliff.
- Each line eventually closes on itself, though often off the edge of the map.
- Going from one line to the next always means going up or down by exactly one contour interval.
Finding the interval
The contour interval is printed near the scale bar at the bottom of the map, for example “CONTOUR INTERVAL 40 FEET.” On USGS 7.5-minute quads it’s commonly 20 or 40 feet. Flat country may use 10 feet, and some steep mountain maps use 80. Always check it. A trail that crosses ten lines climbs 200 feet on a 20-foot map but 400 feet on a 40-foot map.
Index contours
Every fifth contour line is drawn thicker and labeled with its elevation. These index contours let you read heights quickly: find the nearest labeled line and count up or down by the interval. Spot elevations, marked with an x or a small triangle and a number, give exact heights for summits, passes and lakes.
Reading landforms: ridges, valleys, peaks and saddles
Once you can read contours, the terrain starts to look three-dimensional. These are the shapes to recognize:
- Hilltop or summit: a small closed loop, often with a spot elevation. Concentric rings around it show the slopes.
- Valley or drainage: contours form V or U shapes that point uphill, toward higher numbers. A stream often runs through the point of the V. The sharper the V, the steeper and narrower the valley.
- Ridge or spur: contours form V or U shapes that point downhill, toward lower numbers. Trails often follow ridges because they’re drier and have views.
- Saddle or pass: a low point between two higher points, shaped like an hourglass. Trails cross mountains at saddles, and in the West they often have names like “pass” or “gap.”
- Cliff: contour lines crowded so tightly they almost merge. Some maps use a special symbol for rock faces.
- Depression: a closed loop with small tick marks pointing inward, showing a hollow rather than a hill.
The quickest way to tell a ridge from a valley is to check the elevation labels on either side, or look for blue. Water runs in valleys, never along ridge tops.
Map scale and measuring distance
The scale tells you how map distance relates to ground distance. On a 1:24,000 map, one unit on the map equals 24,000 of the same units on the ground, so 1 inch equals 2,000 feet, and about 2.6 inches equals a mile.
| Scale | 1 inch on the map equals | Typical use |
|---|---|---|
| 1:24,000 | 2,000 feet (about 0.38 mile) | USGS 7.5-minute quads; detailed hiking |
| 1:62,500 | about 1 mile | Older USGS 15-minute quads |
| 1:63,360 | exactly 1 mile | Alaska quads |
| 1:100,000 | about 1.6 miles | Regional planning, BLM surface maps |
To measure a winding trail, lay a piece of string along it, then stretch the string against the scale bar. Or tick off distance on the edge of a sheet of paper in short straight segments. Map distance is flat distance, so real walking distance on a steep, switchbacking trail is a little longer than you measure.
How to work out a trail’s steepness
This is where a topo map pays for itself. It tells you before you leave home whether that 4-mile loop is a stroll or a leg-burner.
- Pick a section of trail, for example between a junction and a lake.
- Count the contour lines the trail crosses in that section. Don’t count lines it runs along.
- Multiply by the contour interval. 12 lines on a 40-foot map means 480 feet of climbing.
- Measure the distance on the scale bar, say 0.8 mile (about 4,200 feet).
- Divide rise by run. 480 ÷ 4,200 = 0.11, an 11 percent average grade, or 600 feet per mile.
As rough benchmarks for hikers: under about 5 percent (roughly 250 feet per mile) feels nearly flat, 10 percent (about 500 feet per mile) is a steady climb, and 20 percent (over 1,000 feet per mile) is steep. Some famous trails have short sections far steeper than that, such as the final chain section of Angels Landing in Zion and the rock scramble on Old Rag in Shenandoah. Look for places where the trail’s switchbacks cross lines at nearly every bend; that’s the hardest part of the hike.
Total elevation gain feeds straight into how long a hike takes. Our guide on how far you can hike in a day shows how to turn miles and feet of gain into a realistic time using Naismith’s rule.
Using the map with a compass
A map alone tells you what’s there. A compass tells you which way it is. For basic navigation:
- Orient the map so north on the map points to real north. Then the ridges, lakes and valleys in front of you line up with the map.
- Adjust for declination. A compass points to magnetic north, not true north. In the continental US the difference ranges from roughly 15 degrees east in the Pacific Northwest to about 15 degrees west in Maine, and it changes slowly over time. The declination on an old map may be out of date, so check the current value with NOAA’s magnetic field calculator.
- Use handrails. Rivers, ridges and lakeshores make natural lines to follow, and catching features (a trail junction, a stream crossing) tell you when you’ve gone far enough.
- Watch the contours as you walk. If the map says the trail climbs and you’re going downhill, stop and figure out why.
Where to get topographic maps
The USGS publishes US Topo maps for the whole country, free as GeoPDF files. Download them through The National Map Downloader or the topoView app, which also holds historical maps going back to the 1880s. GeoPDFs can show coordinates and measure distance on a computer or phone. Printed maps are sold through the USGS Store.
One limitation: current US Topo maps don’t show every trail. The USGS explains that trails are problematic because there’s no single national dataset, though the Forest Service, Park Service and other agencies supply trail data and more trails appear each year. For hiking, many people carry a commercial trail map or a national forest map alongside the USGS quad, and use a phone app with downloaded offline maps as a backup. Batteries die and phones break in the cold, which is why a paper map and compass stay on the day hike essentials list.
Practice before you need it
Map reading is a skill you learn at home and on familiar trails. Take a quad for a local hike and follow along: note where contour lines get close and feel the climb in your legs, match the stream crossings to the blue lines, and guess what’s over the next ridge before you top out. After a few hikes, you’ll read a new map and picture the terrain.
The skill scales up. Off-trail travel, from Class 2 scrambling to glacier routes, relies heavily on reading terrain; see from scrambling to mountaineering. Paddlers use topo maps for portages and to spot where a river drops fast, as in how to plan your first canoe trip. In winter, contours show slope angles that matter for avalanche terrain; winter camping for beginners covers route choice in snow. And knowing where the trail runs lets you stay on it, one of the Leave No Trace principles.
A practical last step before any hike: find the steepest section on the map, work out its grade, and note where it starts. Knowing the climb is coming, and roughly how long it lasts, makes it far easier to pace.
Questions people ask
What do the colors on a topographic map mean?
On USGS-style topographic maps, brown lines are contours showing elevation, blue shows water such as lakes, streams and glaciers, and green shades mark wooded areas while white areas are open or sparsely vegetated. Black shows human-made features like buildings, roads, trails and boundaries, and red often marks major roads and survey lines. Private maps from other publishers use similar conventions, but check the legend.
How do you tell if a hill is steep on a topographic map?
Look at the spacing of the contour lines. Lines packed close together mean the ground rises quickly over a short distance, which is steep. Lines spread far apart mean gentle ground. To put a number on it, count the lines a section of trail crosses, multiply by the contour interval to get the elevation gain, then compare it with the distance measured on the scale bar.
What is a contour interval?
The contour interval is the vertical distance between neighboring contour lines, printed in the map's bottom margin. On USGS 7.5-minute quadrangles it is commonly 20 or 40 feet, smaller in flat country and larger in steep mountains. Every fifth line, called an index contour, is drawn thicker and labeled with its elevation, which lets you read heights quickly without counting from the bottom.
Where can I get free topographic maps?
The USGS offers free US Topo maps for the whole country as downloadable GeoPDF files through The National Map Downloader and the topoView app, which also has historical maps back to the 1880s. Printed USGS maps are sold through the USGS Store. Many hiking apps use USGS topo data as a base layer. National park visitor centers also sell detailed trail maps from commercial publishers.
What is the difference between a ridge and a valley on a topo map?
Both show up as V or U shapes in the contour lines, so check which way they point. In a valley or drainage, the V points uphill, toward higher elevation numbers, and there's often a blue stream line running through it. On a ridge or spur, the V or U points downhill, toward lower numbers. A saddle, or pass, is a low point between two hilltops, shaped like an hourglass.
Keep going
Next on the trail
What to Pack for a Day Hike: The Ten Essentials and a Practical Checklist
For a day hike, pack the Ten Essentials the National Park Service recommends: navigation, sun protection, extra clothing, a headlamp, first aid…
Oct 6, 2026 · 7 min

What to Put in an Outdoor First Aid Kit: A Hiking and Camping Checklist
An outdoor first aid kit should cover what actually happens on the trail: blisters, cuts, sprains, splinters, ticks, stings and stomach trouble.…
Oct 6, 2026 · 7 min
The 7 Leave No Trace Principles, Explained With Real Trail Examples
The seven Leave No Trace principles are: plan ahead and prepare; travel and camp on durable surfaces; dispose of waste properly; leave…
Sep 29, 2026 · 7 min